Quickstart
- Your single cell data is in the correct format. See the data preparation guide for details
- Your single cell data is clustered or has cell types assigned or contains some other source of heterogeneity you'd like to build your antibody panel around
Generating the initial marker panel
Step 1: Data upload
Start by clicking "Browse" to upload your single cell data in a variety of popular formats.
See data preparation guide for more details.
Step 2: Set marker panel options
Basic/Required Options
- Cell category to evaluate This is a feature of each cell, such as a cell type, cluster, disease subtype, etc. that you would like the panel to capture the variation in. In other words, the panel should be able to resolve cells of differing types of what is selected here
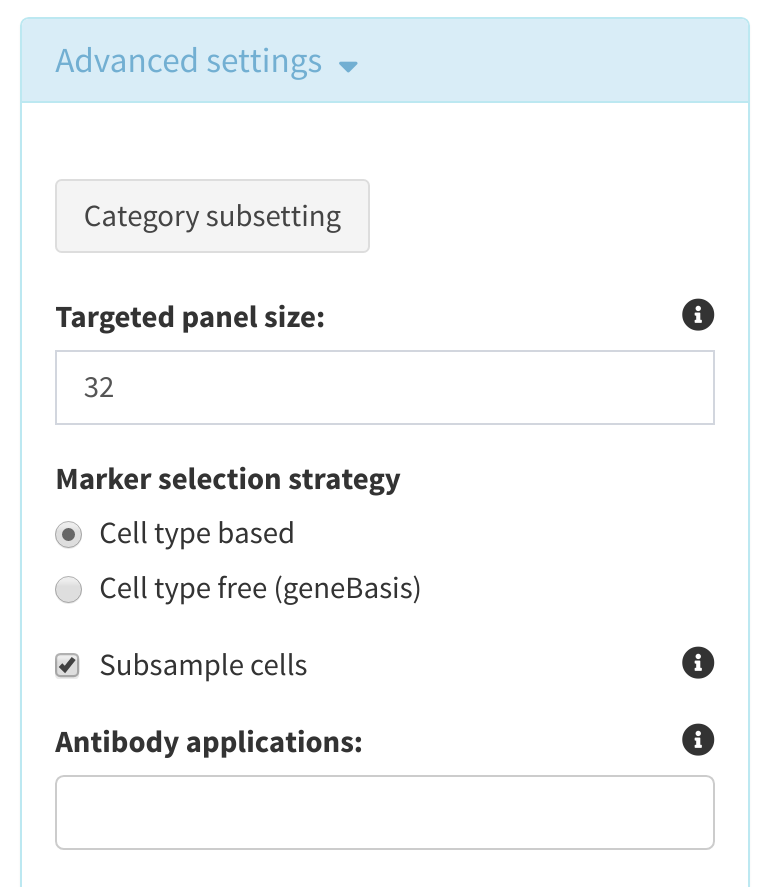
Advanced Options
The following options are optional for analysis, and have default values assigned to them which are intended to give a basic, well-rounded analysis. These options can be changed by clicking the Advanced Options dropdown menu.
-
Category Subsetting For the cell cetagory selected above, the user may generate subsets based on both the different factors in cell type (i.e. excluding T-cells in immune cell profiling), or by setting a minimum number of cells required for each level. Furthermore, these thresholds can be modified recursively with the same dataset in order to evaluate the effects of excluding certain cell types in analysis. This generates a data subset where certain cell subtypes can be ignored entirely in analysis, which can be beneficial for generating higher specificity panels for certain cell types.
-
Targeted panel size The size of the panel to be designed and will be determined by what experimental technology the panel is being used for. The panel size may be enlarged/decreased as the panel is refined in subsequent steps. Note: The default panel size is 32 markers. It is not recommended to select a panel size greater than 100, as performance will be compromised and there may be redundant genes markers for the same cell type.
-
Marker selection strategy cytomarker can either select markers that attempt to differentiate between the cell type/condition selected under Cell category to evaluate or use geneBasis, which attempts to identify a panel that best captures the heterogeneity of the data without pre-specifying cell types/clusters. Note that if
geneBasisis selected, then the entry selected under Capture heterogeneity of is only used for subsequent visualization and scoring. -
Subsample cells If selected, the input data is randomly subsampled to 2000 cells (if more than 2000 cells are present) to improve performance. By default this is set to True.
-
Precomputed UMAP cytomarker will detect on file upload if the provided dataset already has a UMAP dimension assay. If detected, the option to include the precomputed UMAp coordinates in the all genes UMAP plot is made visible. The user may select this option and subsequently select the name of the dimension desired, if multiple UMAP assays are detected. This option is not made visible for datasets with no UMAP assay.
-
Antibody applications If only certain antibodies applications are applicable (e.g. for flow cytometry) then selecting here will restrict markers to only those with validated antibodies for that application.
Then, click Run analysis ▶ to build the initial panel!
Reuploading a previous run
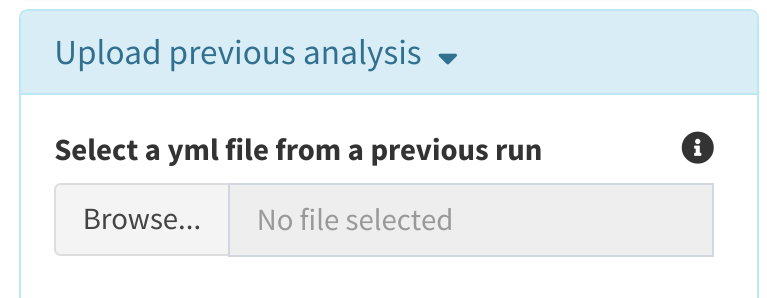
cytomarker accepts yml files from previously saved analyses in order to continue with an existing marker panel. The yml file must have been created from a saved analysis, and is expected to have certain fields that will populate the run parameters. Note: Saved yml files will have the dimensions of the dataset used to create them. If the user attempts to run analysis using a yml with a different dataset, this is permitted, but a warning is issued.
cytomarker also permits the uploading of minimal yml files containing just the selected and scratch marker panel. In this instance, the yml must be formatted in the following way:
Resetting the analysis

By default, cytomarker will retain an existing marker panel for subsequent runs, in order to allows users to evalyate how parameter modification may affect the cell types that express certain markers. In order to commence a fresh analysis and generate an entirely new panel, the user may select Reset marker panel under Advanced Options
Refining the marker panel
The initial panel will appear under Selected markers.
The panel may then be refined in multiple ways.
A recommended marker from the initial panel will always have a ★ next to it to help you keep track
Select and replace markers
The current panel is displayed under Selected markers. Each marker may be dragged to the scratch space to remove it from the current panel. To add it back in, simply drag it back to Selected markers. Note that when re-running the analysis, only the markers in Selected markers will be considered in the results.
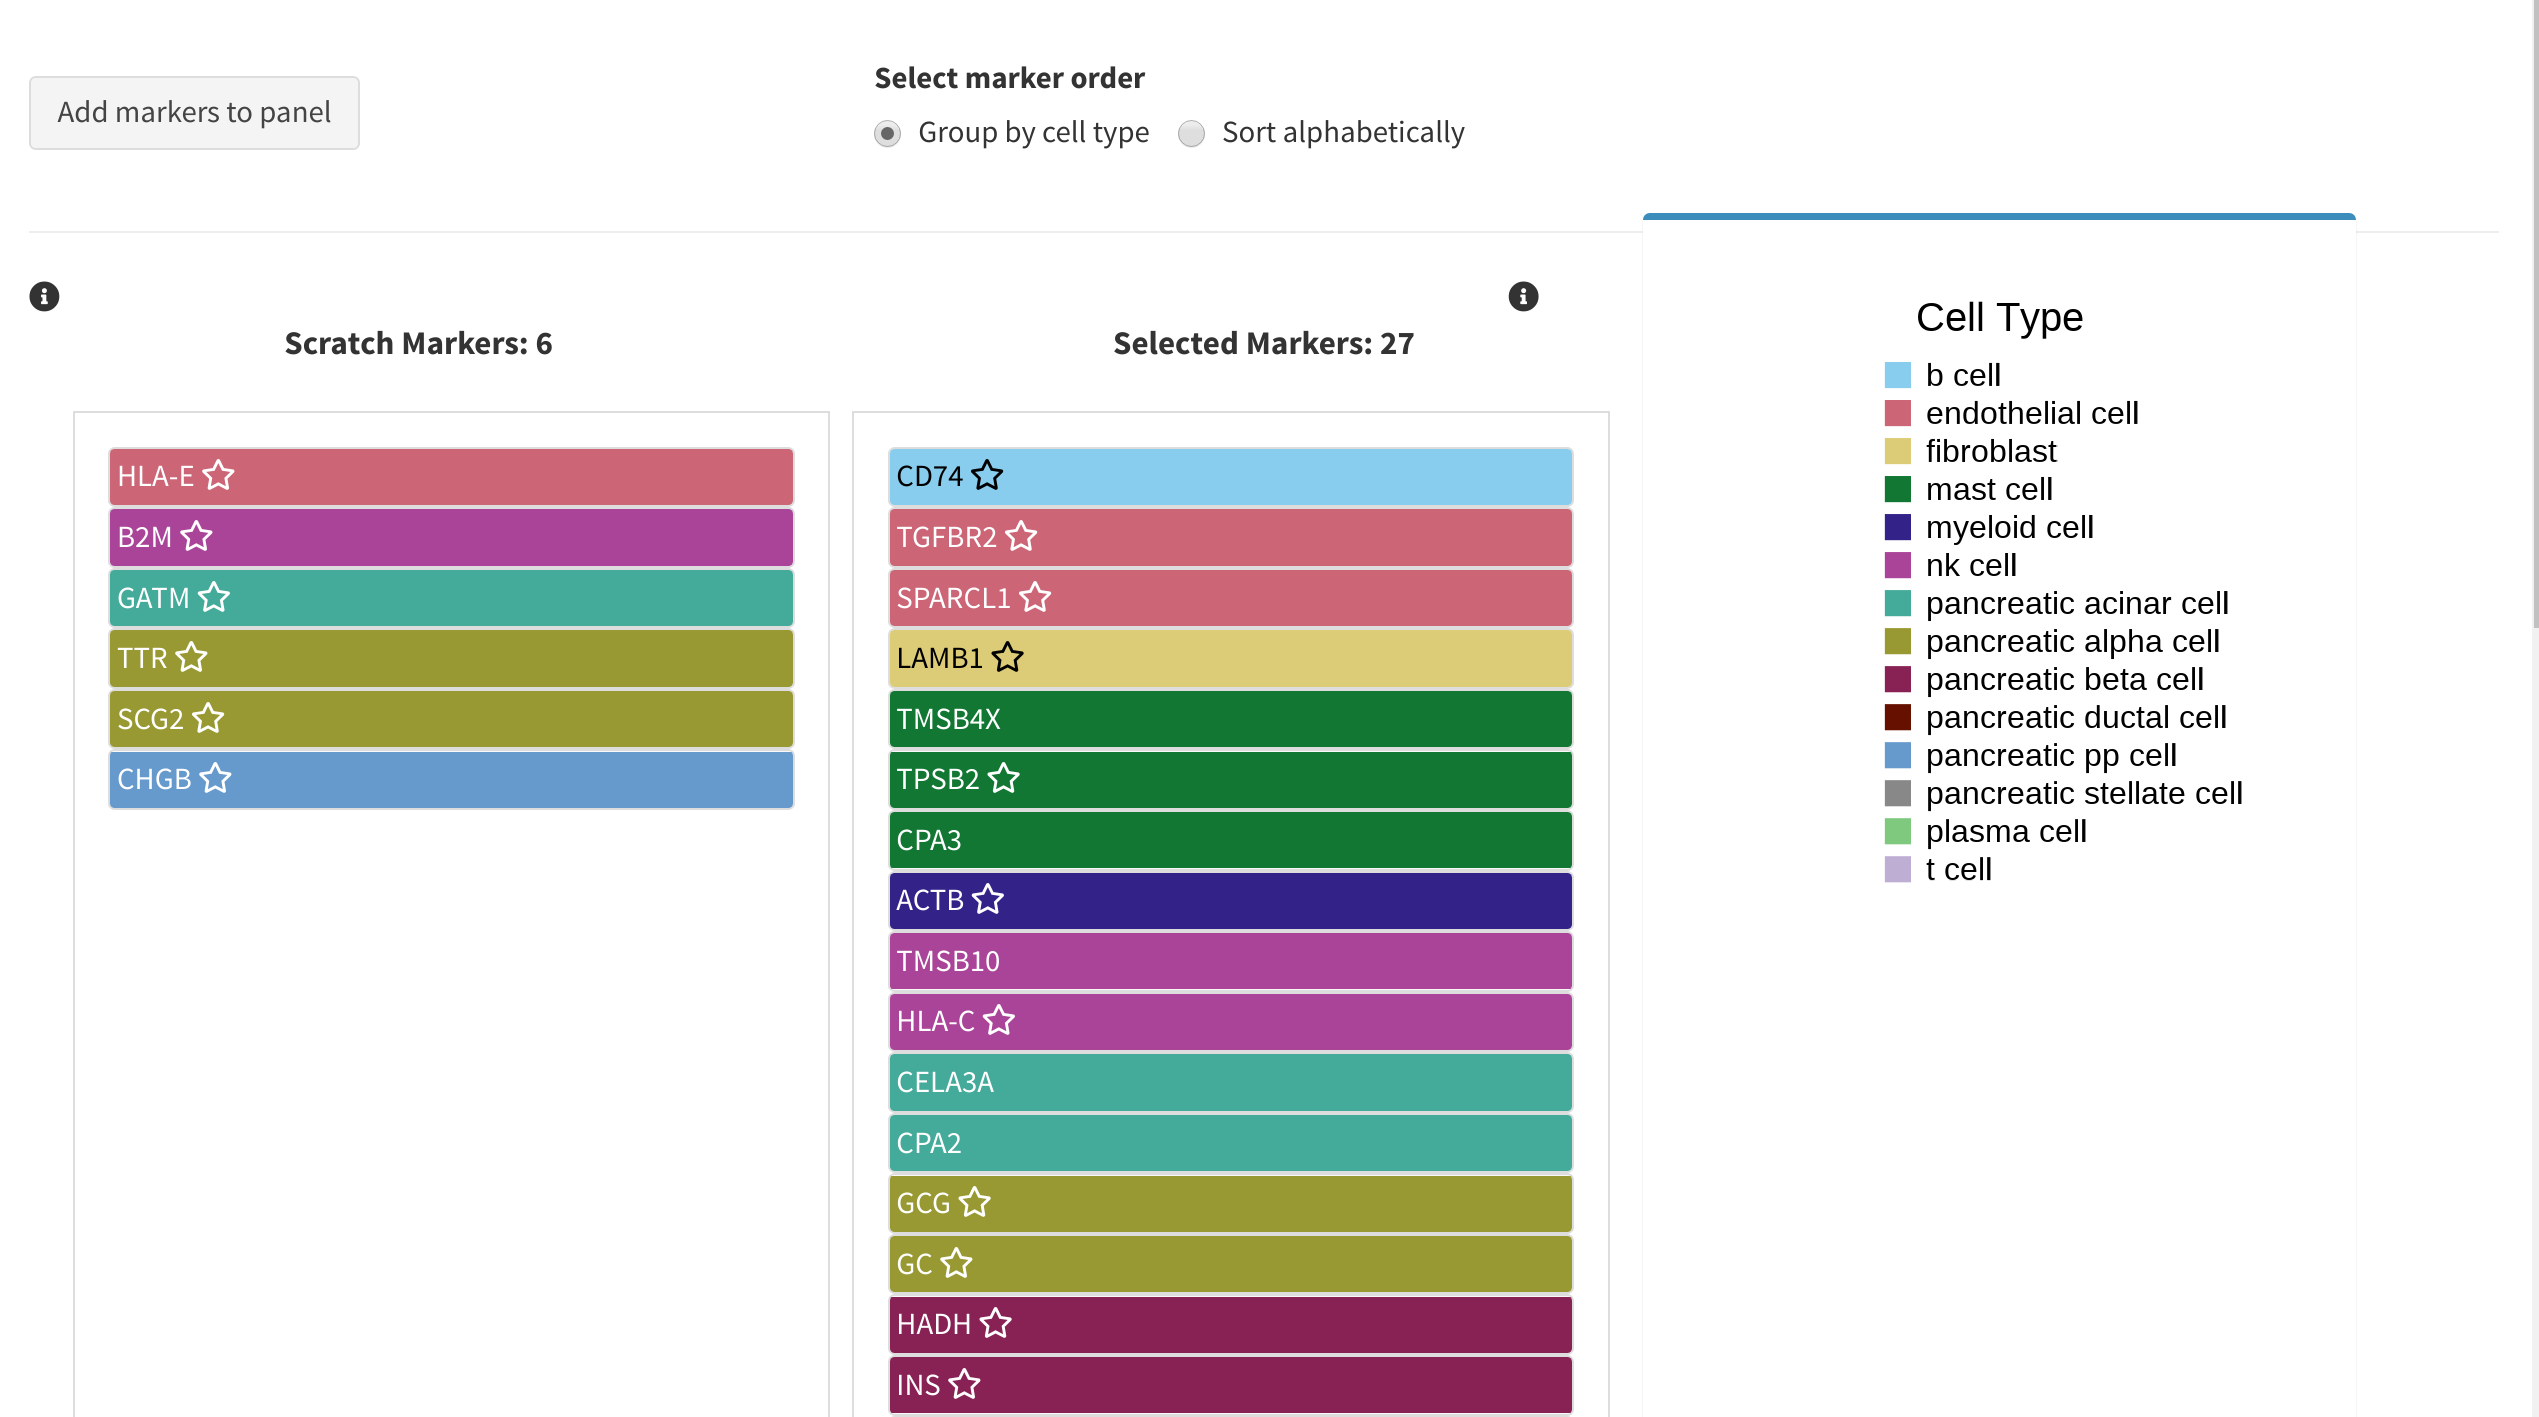
The colour of each marker corresponds to the cell type/cluster it is most over expressed in. However, it may be a marker for more than just that cell type. To explre the expression of a given marker across all cell types, use the Gene Expression analysis tab.
Marker lists may be sorted/grouped either by cell type grouping(default) or sorted alphabetically, and toggled with the control directly above the panel space.
Manually add markers
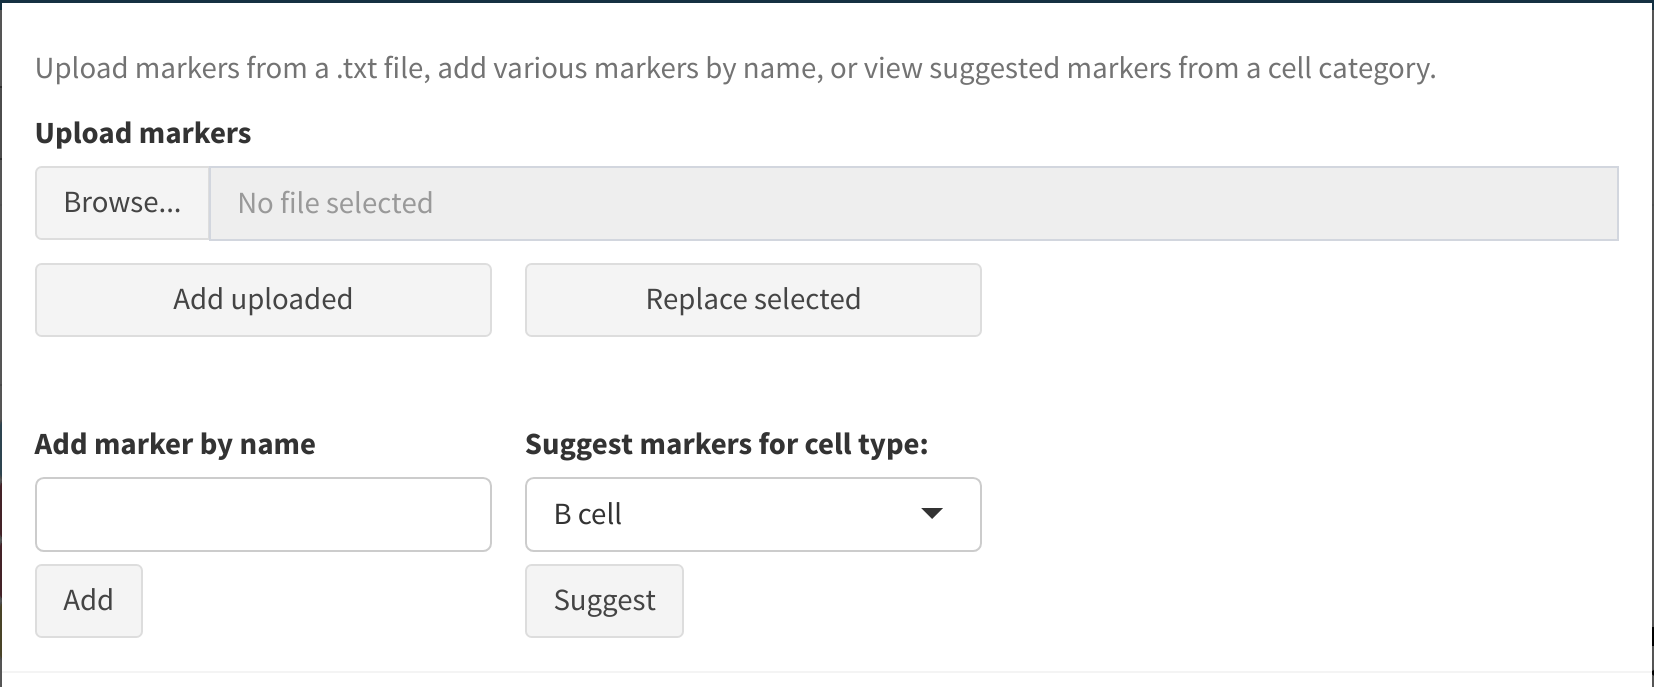
Markers may be added individually or in bulk using the Manual add markers textbox. This will autocomplete with the set of possible markers based on the input single-cell data and selected antibody applications. Alternatively, a list of markers (from e.g. a previous panel) may be bulk uploaded. This should be in the form of a text file with one marker per line.
Users should be careful to review that the markers he/she is attempting to add are contained in the dataset. cytomarkerl will filter out any markers that are not present in the data and warn the user if this occurs.
Add markers for a given cell type
Sometimes after assessing the marker panel it is necessary to add more markers for a certain cell type in order to increase the power of the panel to identify that cell type. To do so, under Suggest markers for cell type select the cell type that requires more markers and press Suggest. You can then order the suggested markers by summary log fold change and select any you would like added, before pressing Add selected.
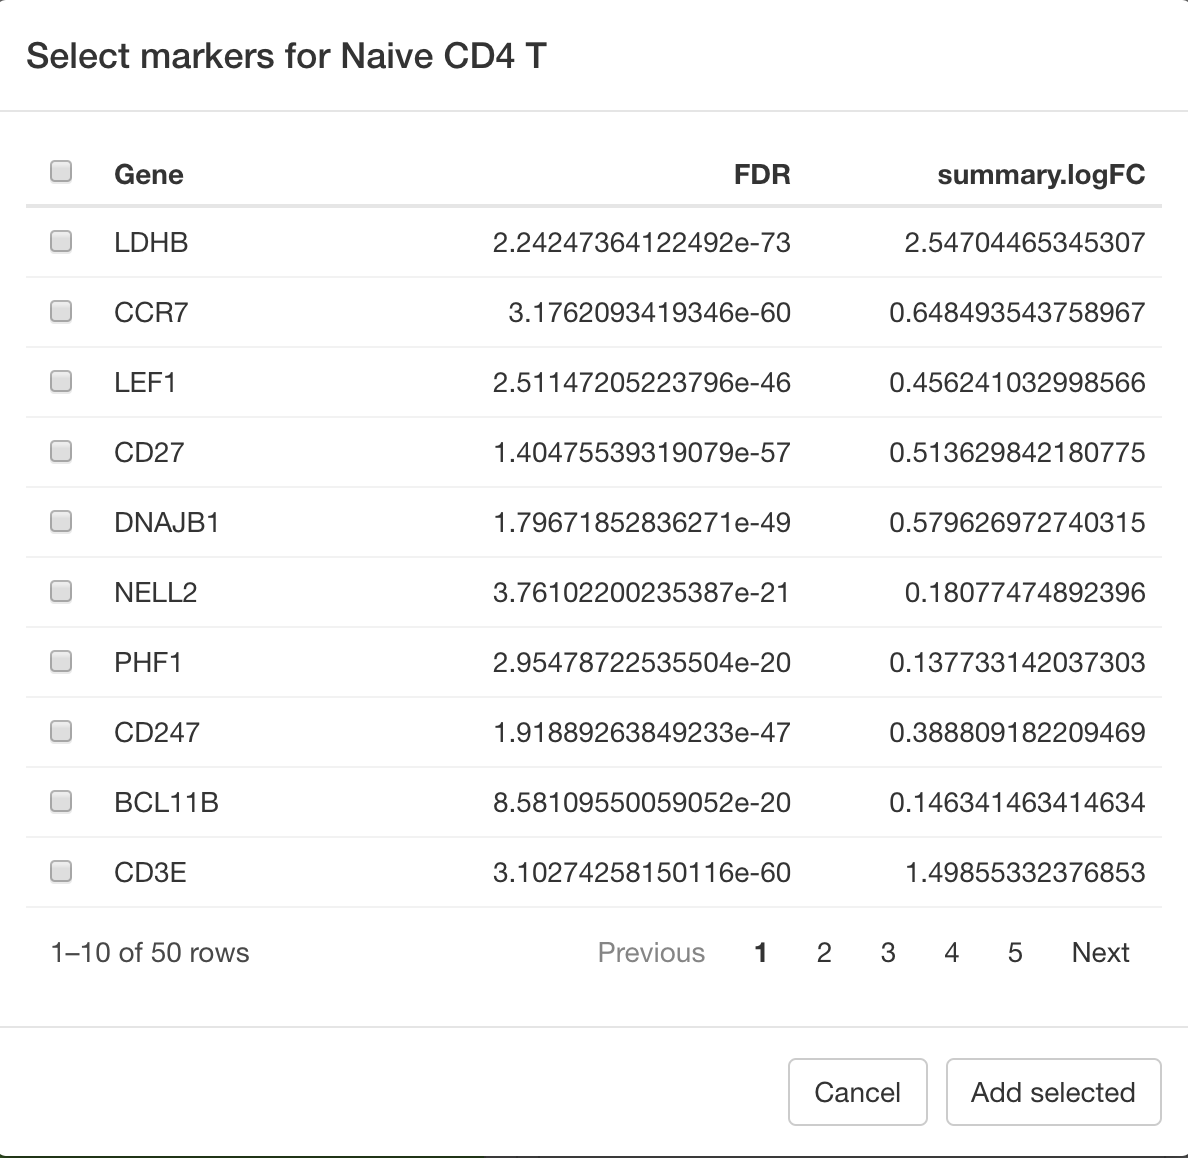
Any time the marker panel is changed, be sure to click Run analysis ▶ again to refresh the plots and scores.
Assessing the marker panel
cytomarker has several tools to help iteratively build a marker panel that well captures the desired cell types/clusters while avoiding redundancy.
Gene Expression tab
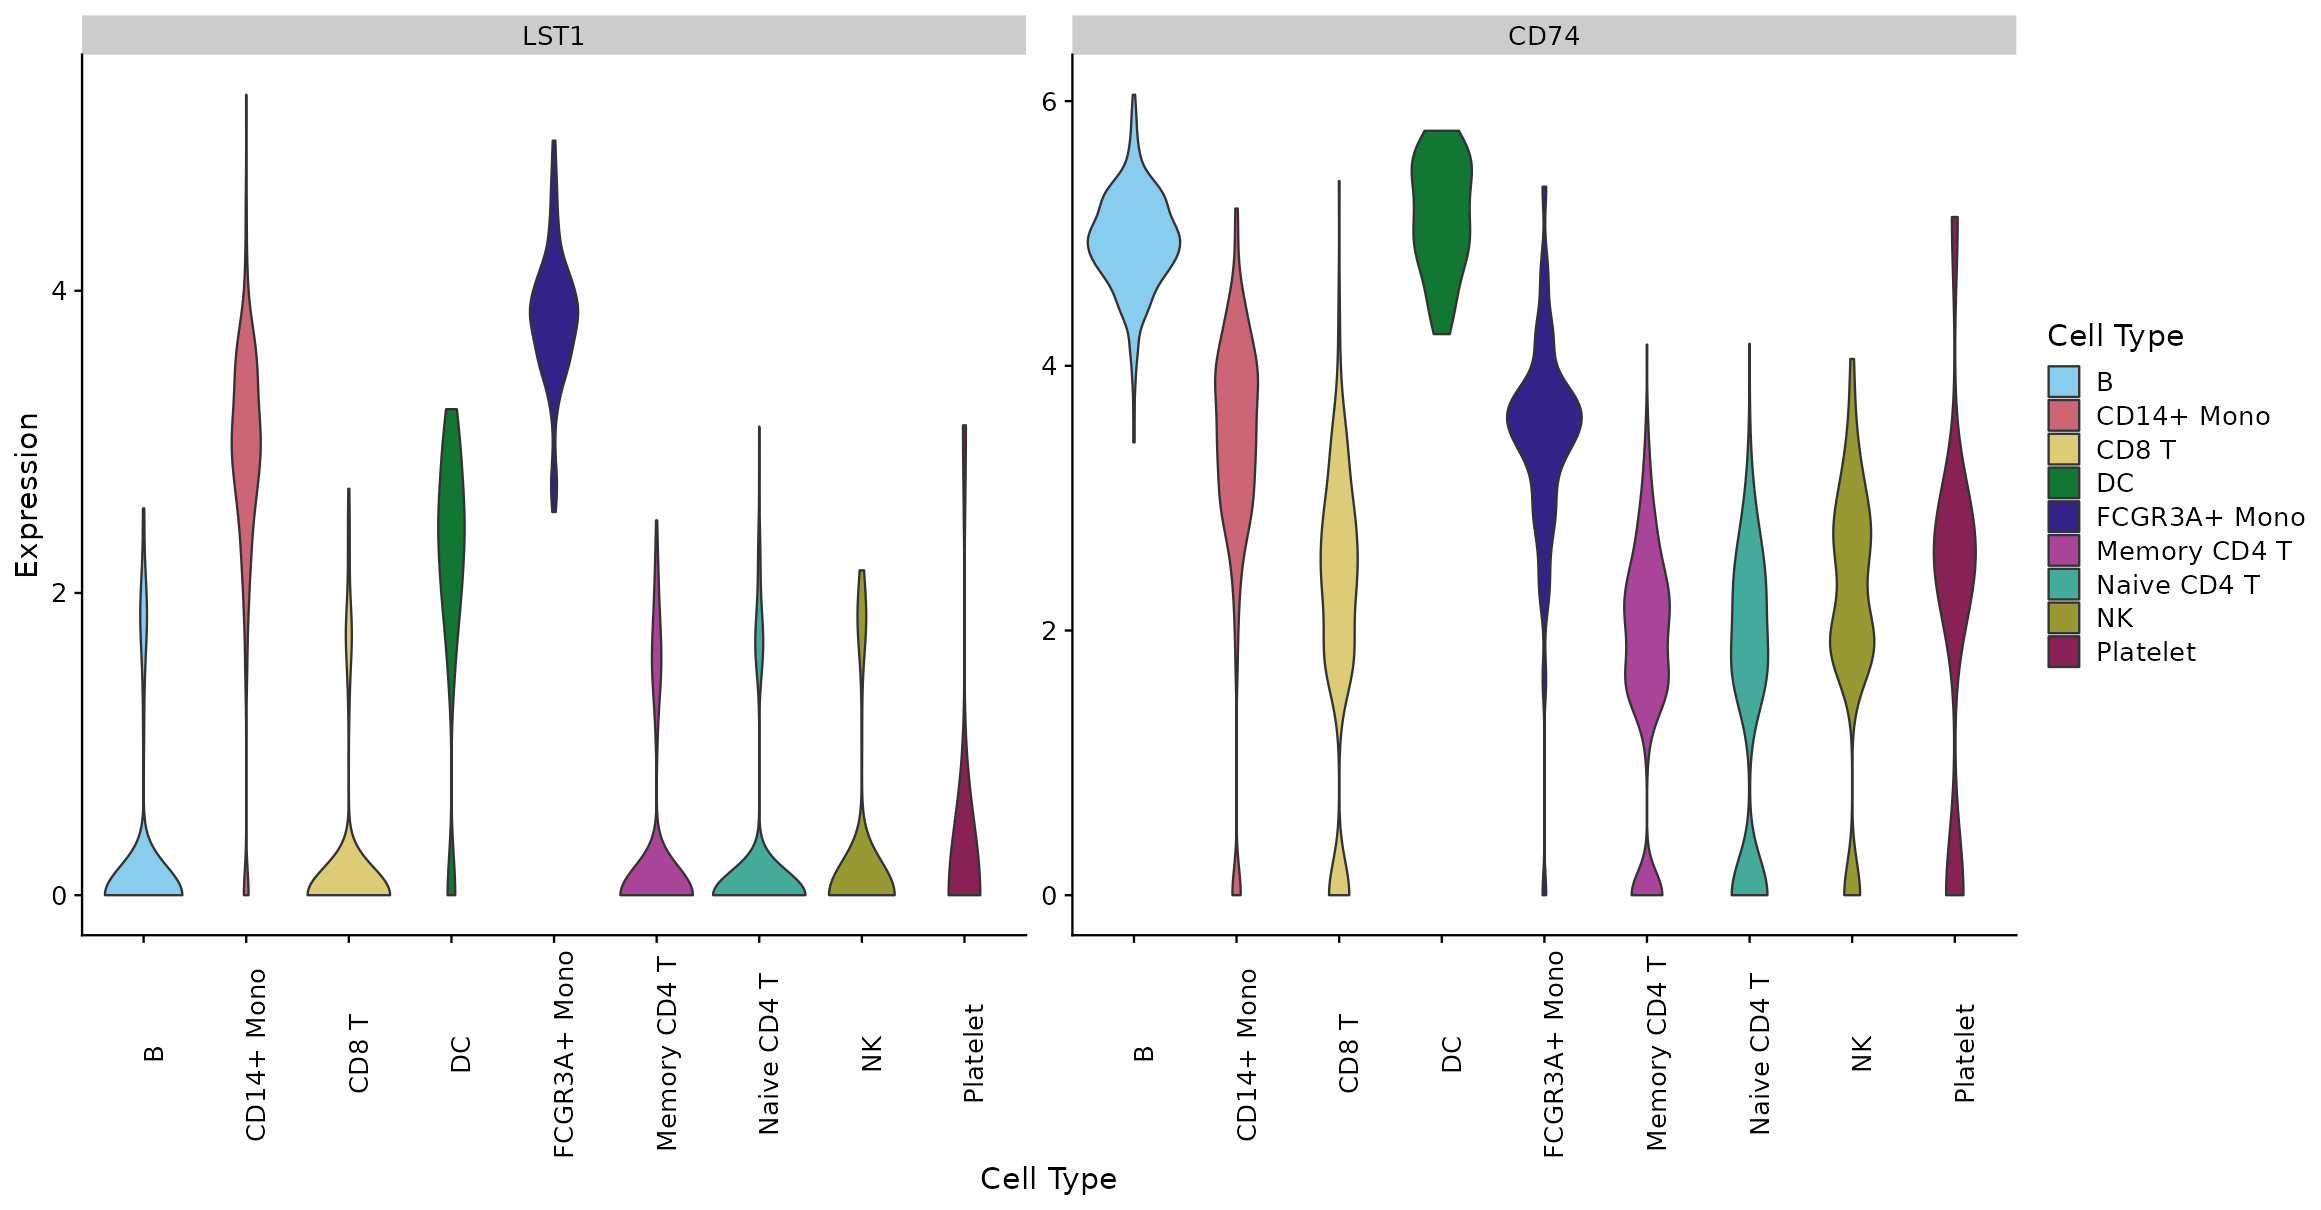
The expression patterns of combinations of any genes in the dataset can be viewed as violin plots. Violin plots are used extensively in scRNA-seq analysis to desmonstrate probability distributions of the expression of gene counts or logcounts across cell categories. More information about the use of violin plot visualizations in canonical R packages can be found here. In cytomarker, the plots can be viewed either by gene (where each gene gets an individual profile), opr by cell type, where each cell category will get an individual profile for comparing 1 or more genes. These views can be toggled back and forth to provide a complete picture of relative gene expression.
UMAP tab
UMAP is a nonlinear dimensionality reduction tool popular in the analysis of single-cell data. cytomarker includes the ability to compare a UMAP embedding using all genes (left) to that using only the selected panel (right), to provide a qualitative visual inspection of panel quality.
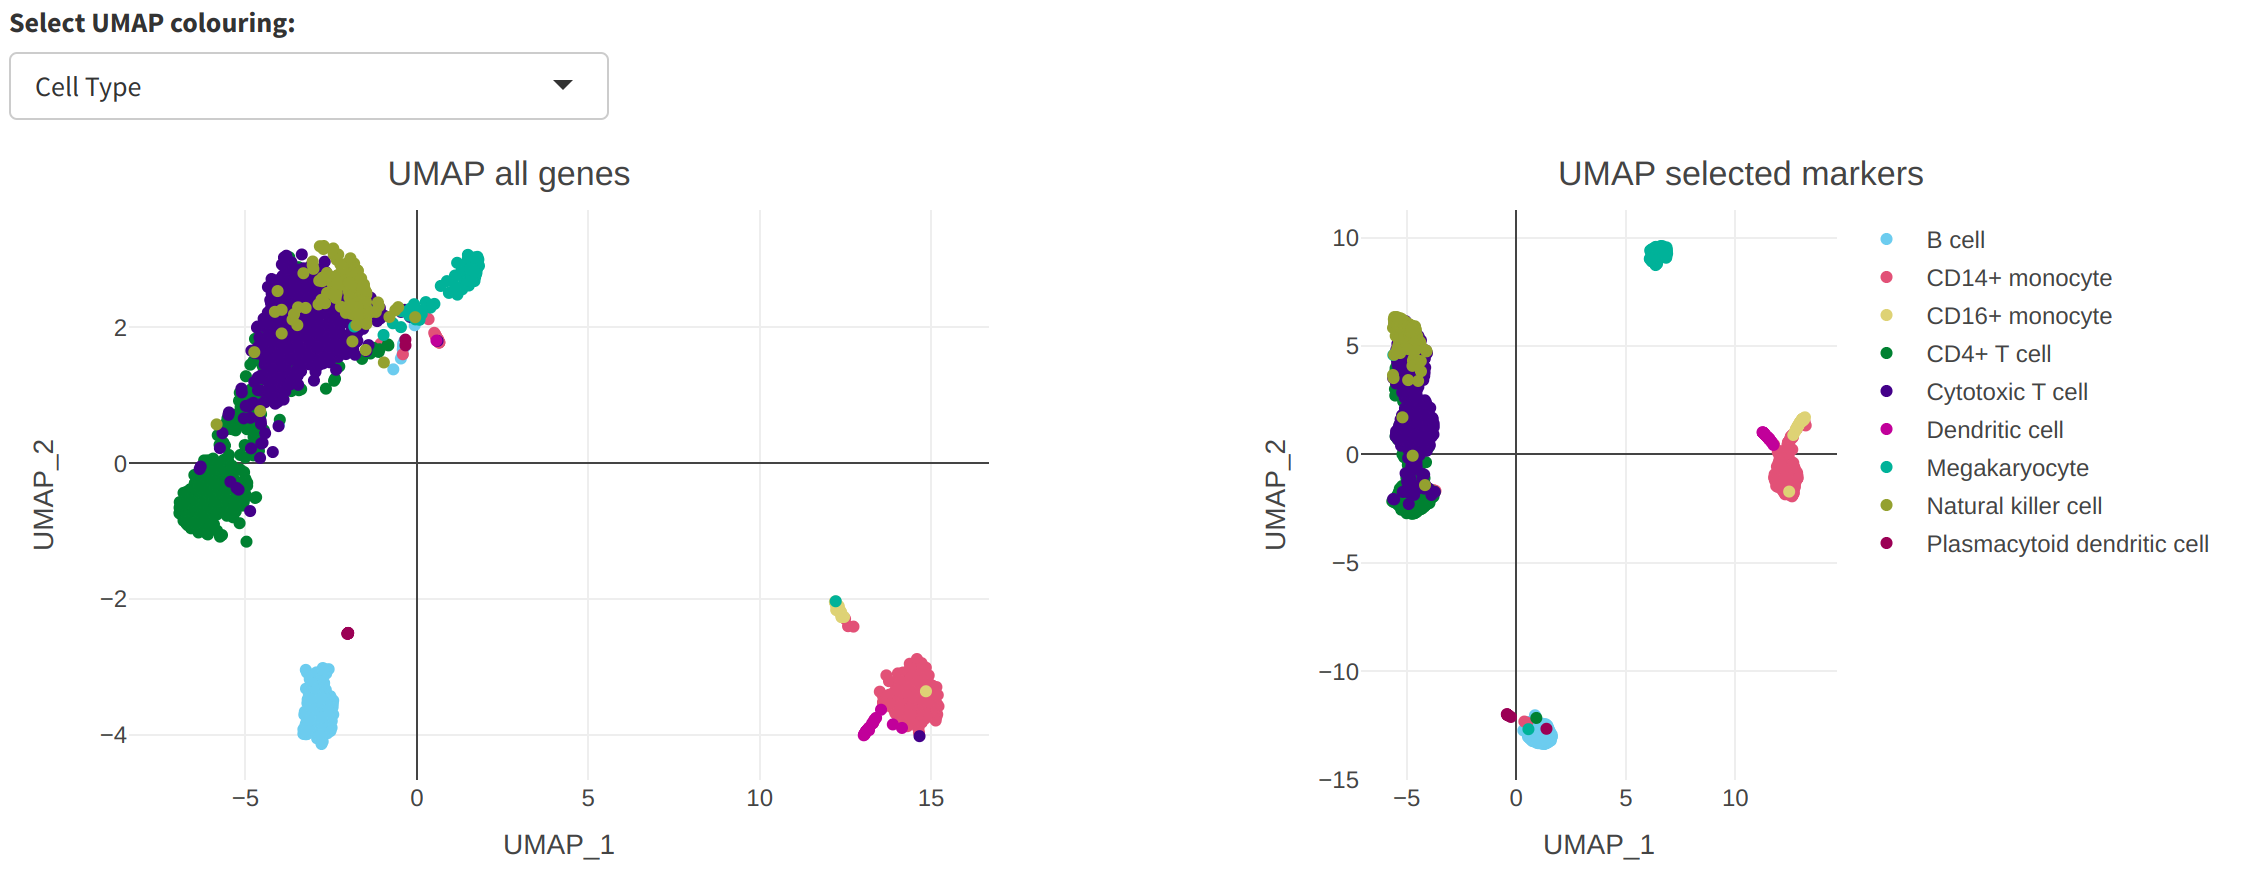
Additionally, the user may toggle the different colouring options for the cells in the UMAP, from either the selected cell type category (default, as shown above) or the expression of any of the genes in the current panel (seen below for CD74).
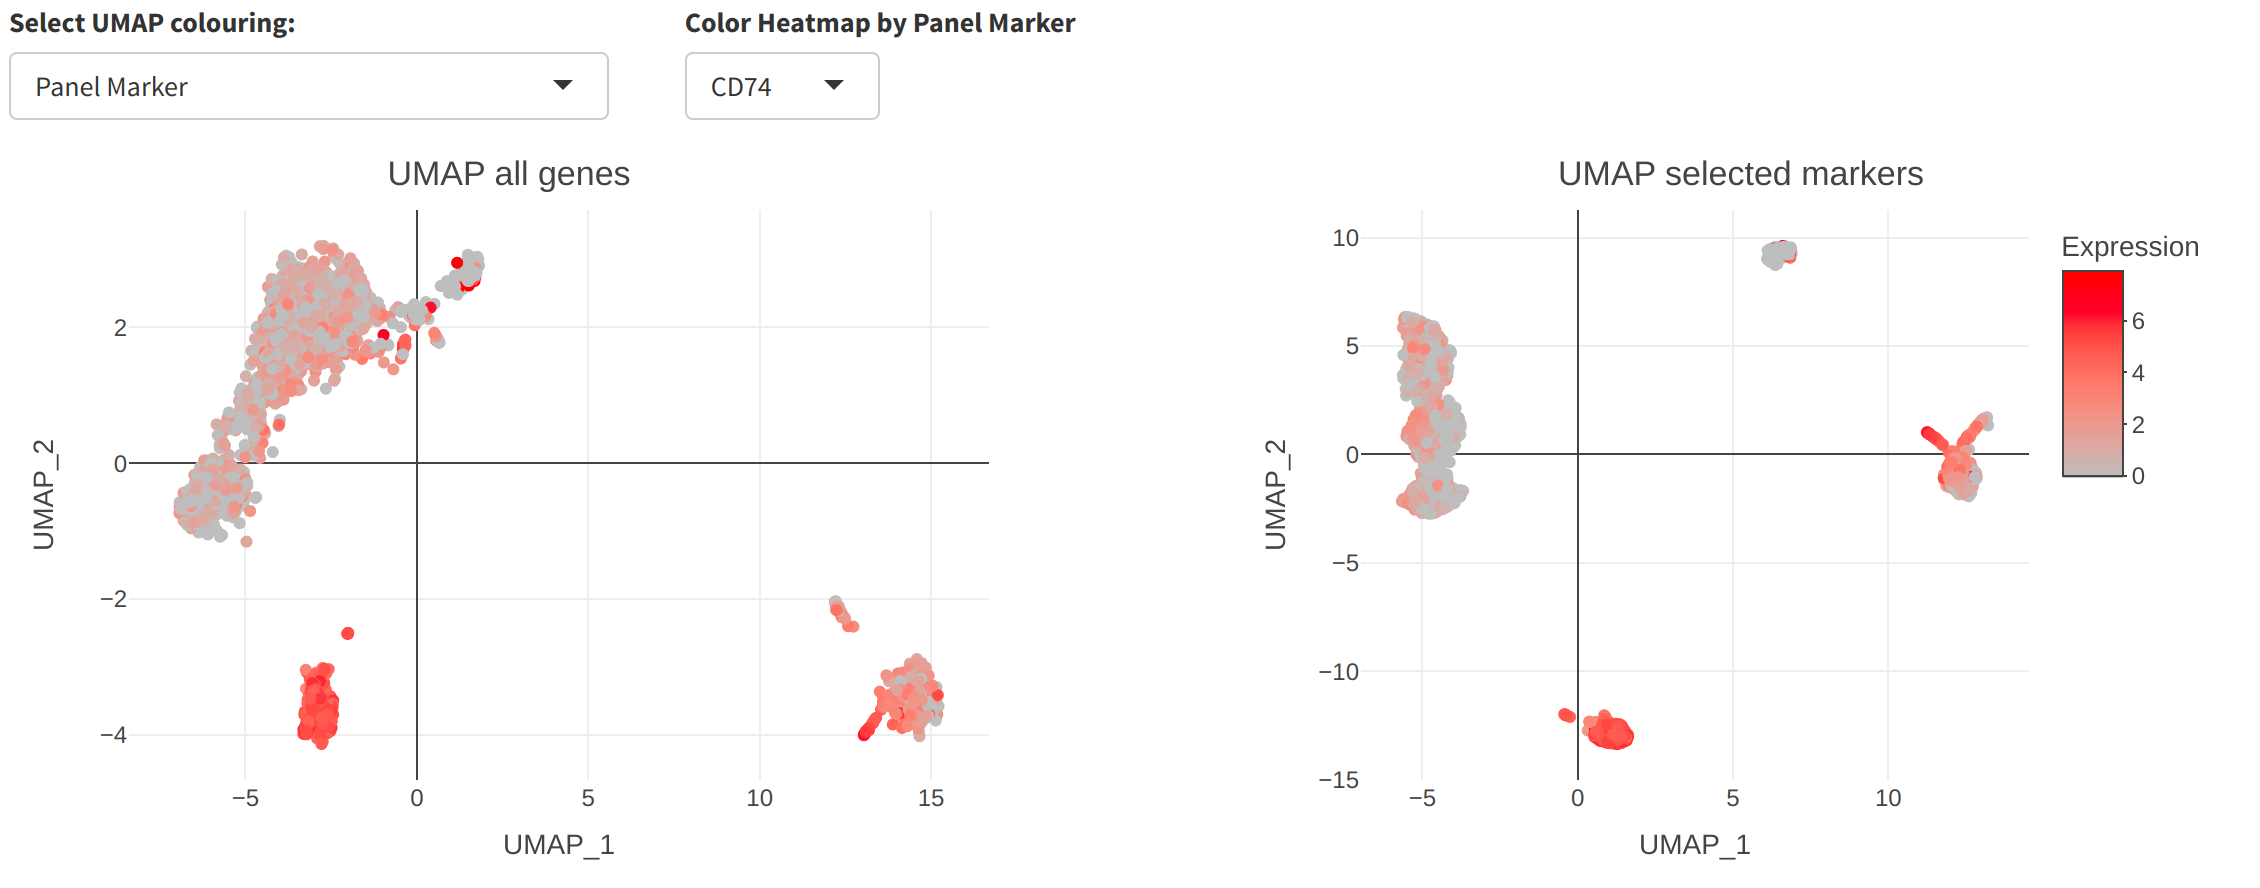
UMAP may be useful for quick visual inspection of panel quality but has well-known limitations Use caution when interpereting the similarity or differences among cells using UMAP projections.
Heatmap tab
Both marker-marker correlation and per-cell type expression may be visualized on the heatmap tab. The marker-marker correlation plot provides measurements of co-expression of the genes in the marker panel relative to each other. Toggling the heat map input options to the cell type of interest allows the user to view the overall expression of these marker genes straified by the levels of the cell types. Both expression, in either counts or log-transformed counts, as well as a z-score can be viewed for the cell type of interest.
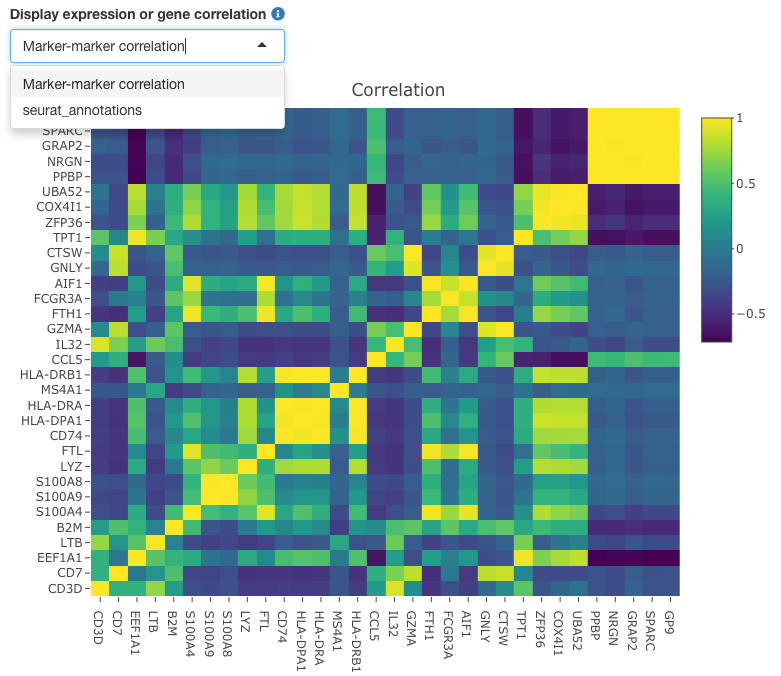
Removal of redundant markers
In order to produce a marker panel with minimal gene expression redundancy, cytomarker provides a method to remove genes from the current panel based on co-expression. For a set number of genes, cytomarker will provide a ranked list of the genes that are most highly co-expressed/correlated to each other. These genes are good candidates for removal as their inclusion does not help to provide additional resolution on the cell type category as compared to other genes in the panel. Once genes have been removed from the current panel, ther user should re-run the analysis to evaluate the effect of gene removal on the run scores.

Metrics tab
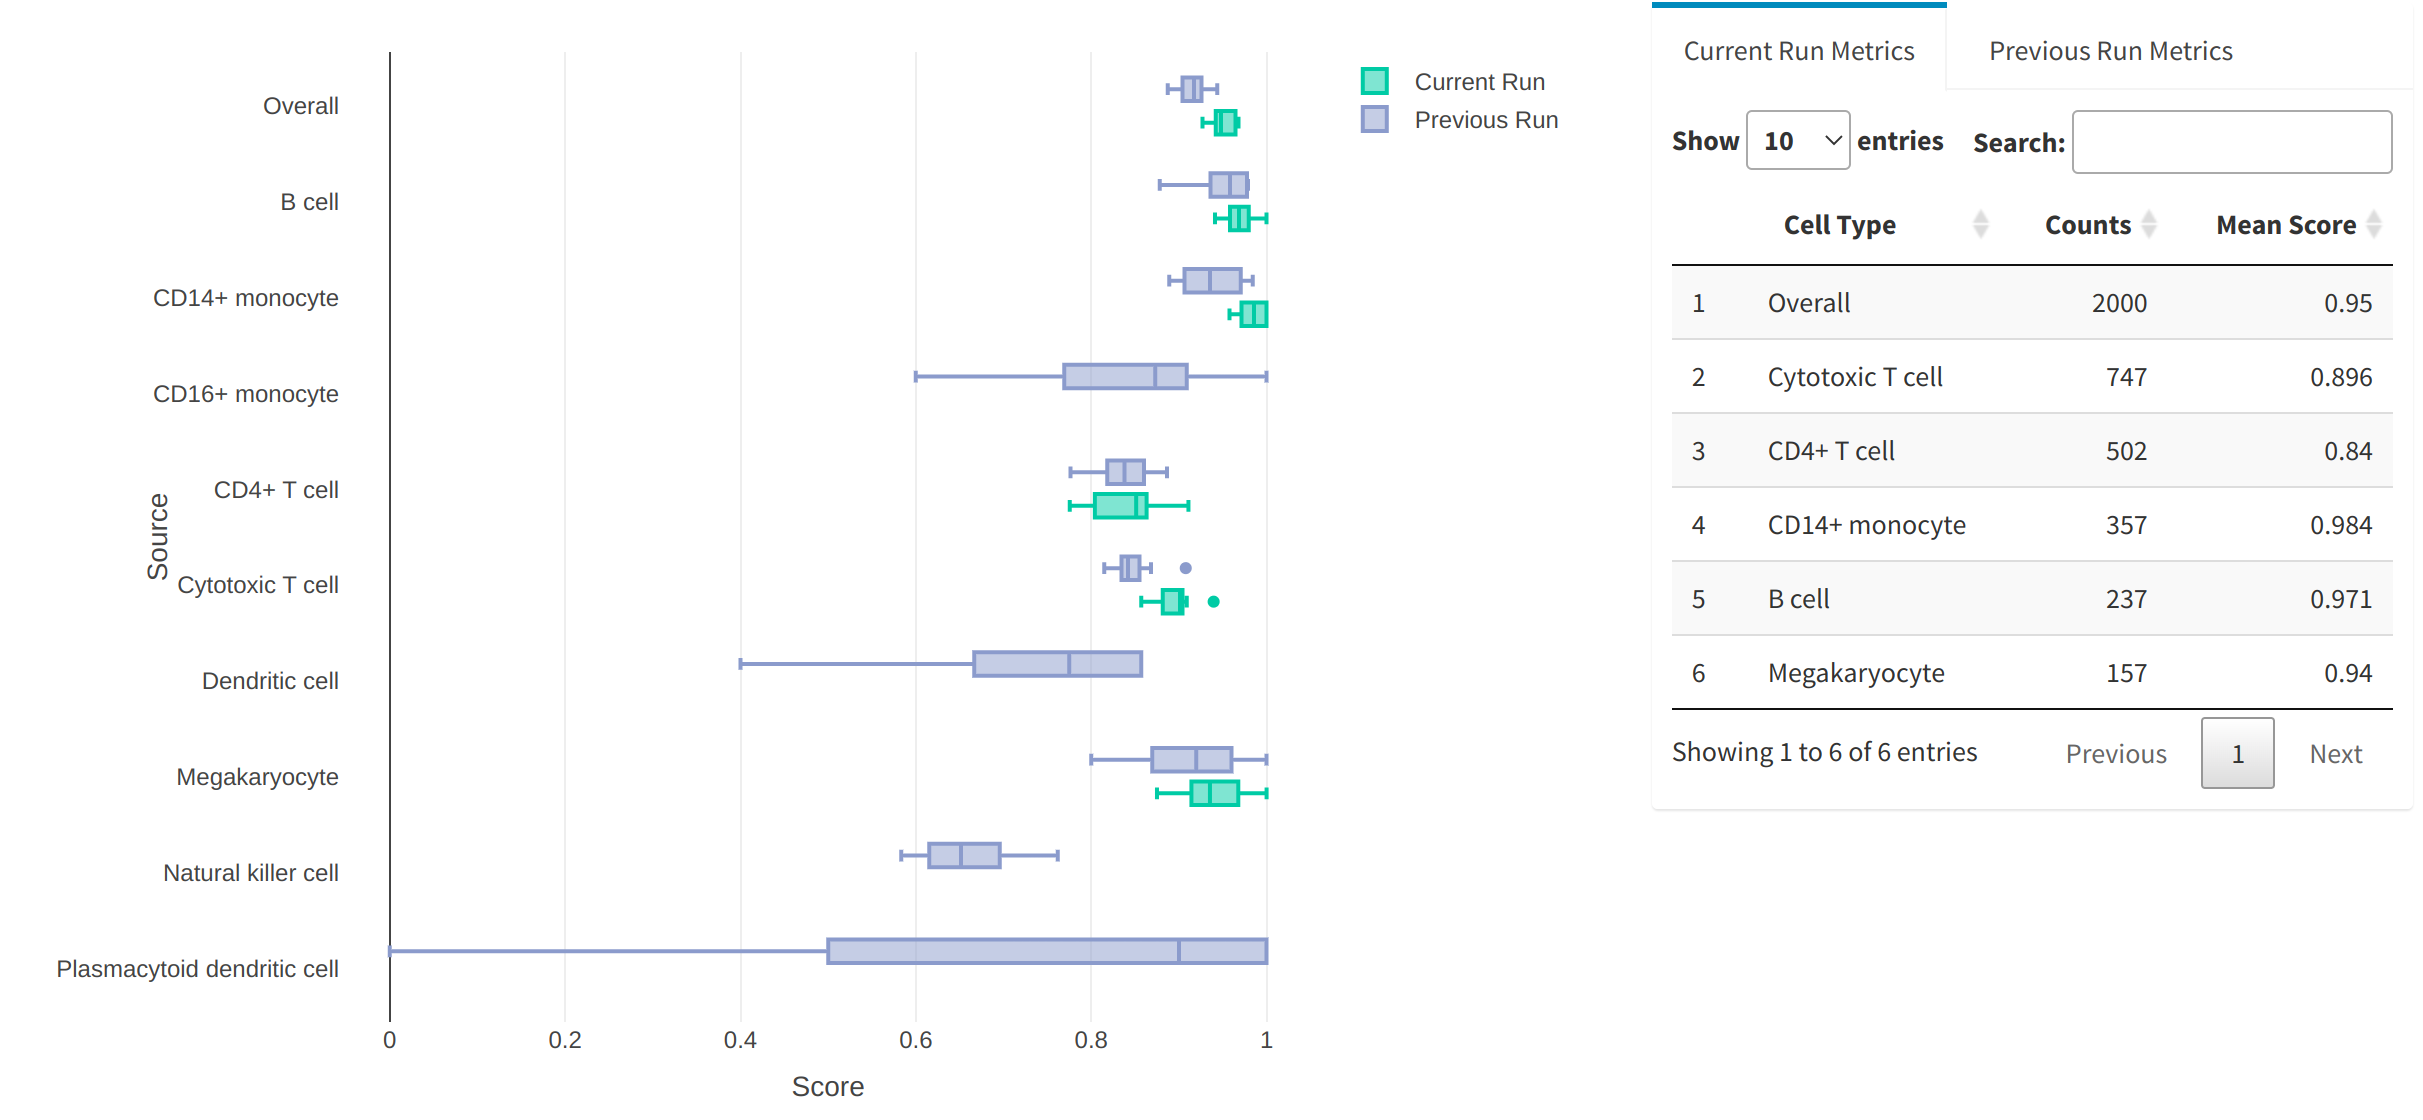
cytomarker runs a multinomial logistic regression modal using neural networks for each level in the cell type category based on the genes in the current panel. The score from this model is a logistic prediction of the probability of that cell being assigned to the particular cell type, given its gene expression. Values closer to 1 represent gene panel lists that provide accurate prediction for the particular cell type, whereas scores closer to 0 are poorer, and reflect gene sets that to not resolve the hetrogeneity well.
Under the Metrics tab, the user can view the distribution of assignment scores for each cell type category, as well as the summary statistics in table format. cytomarker also retains the scores the both the current run and the most immediate run before it, so that users may compare the performance of consecutive runs where certain run parameters are modified (i.e. how does the scoring change when certain cell types are included/excluded, if subsampling is turned on/off, etc.)
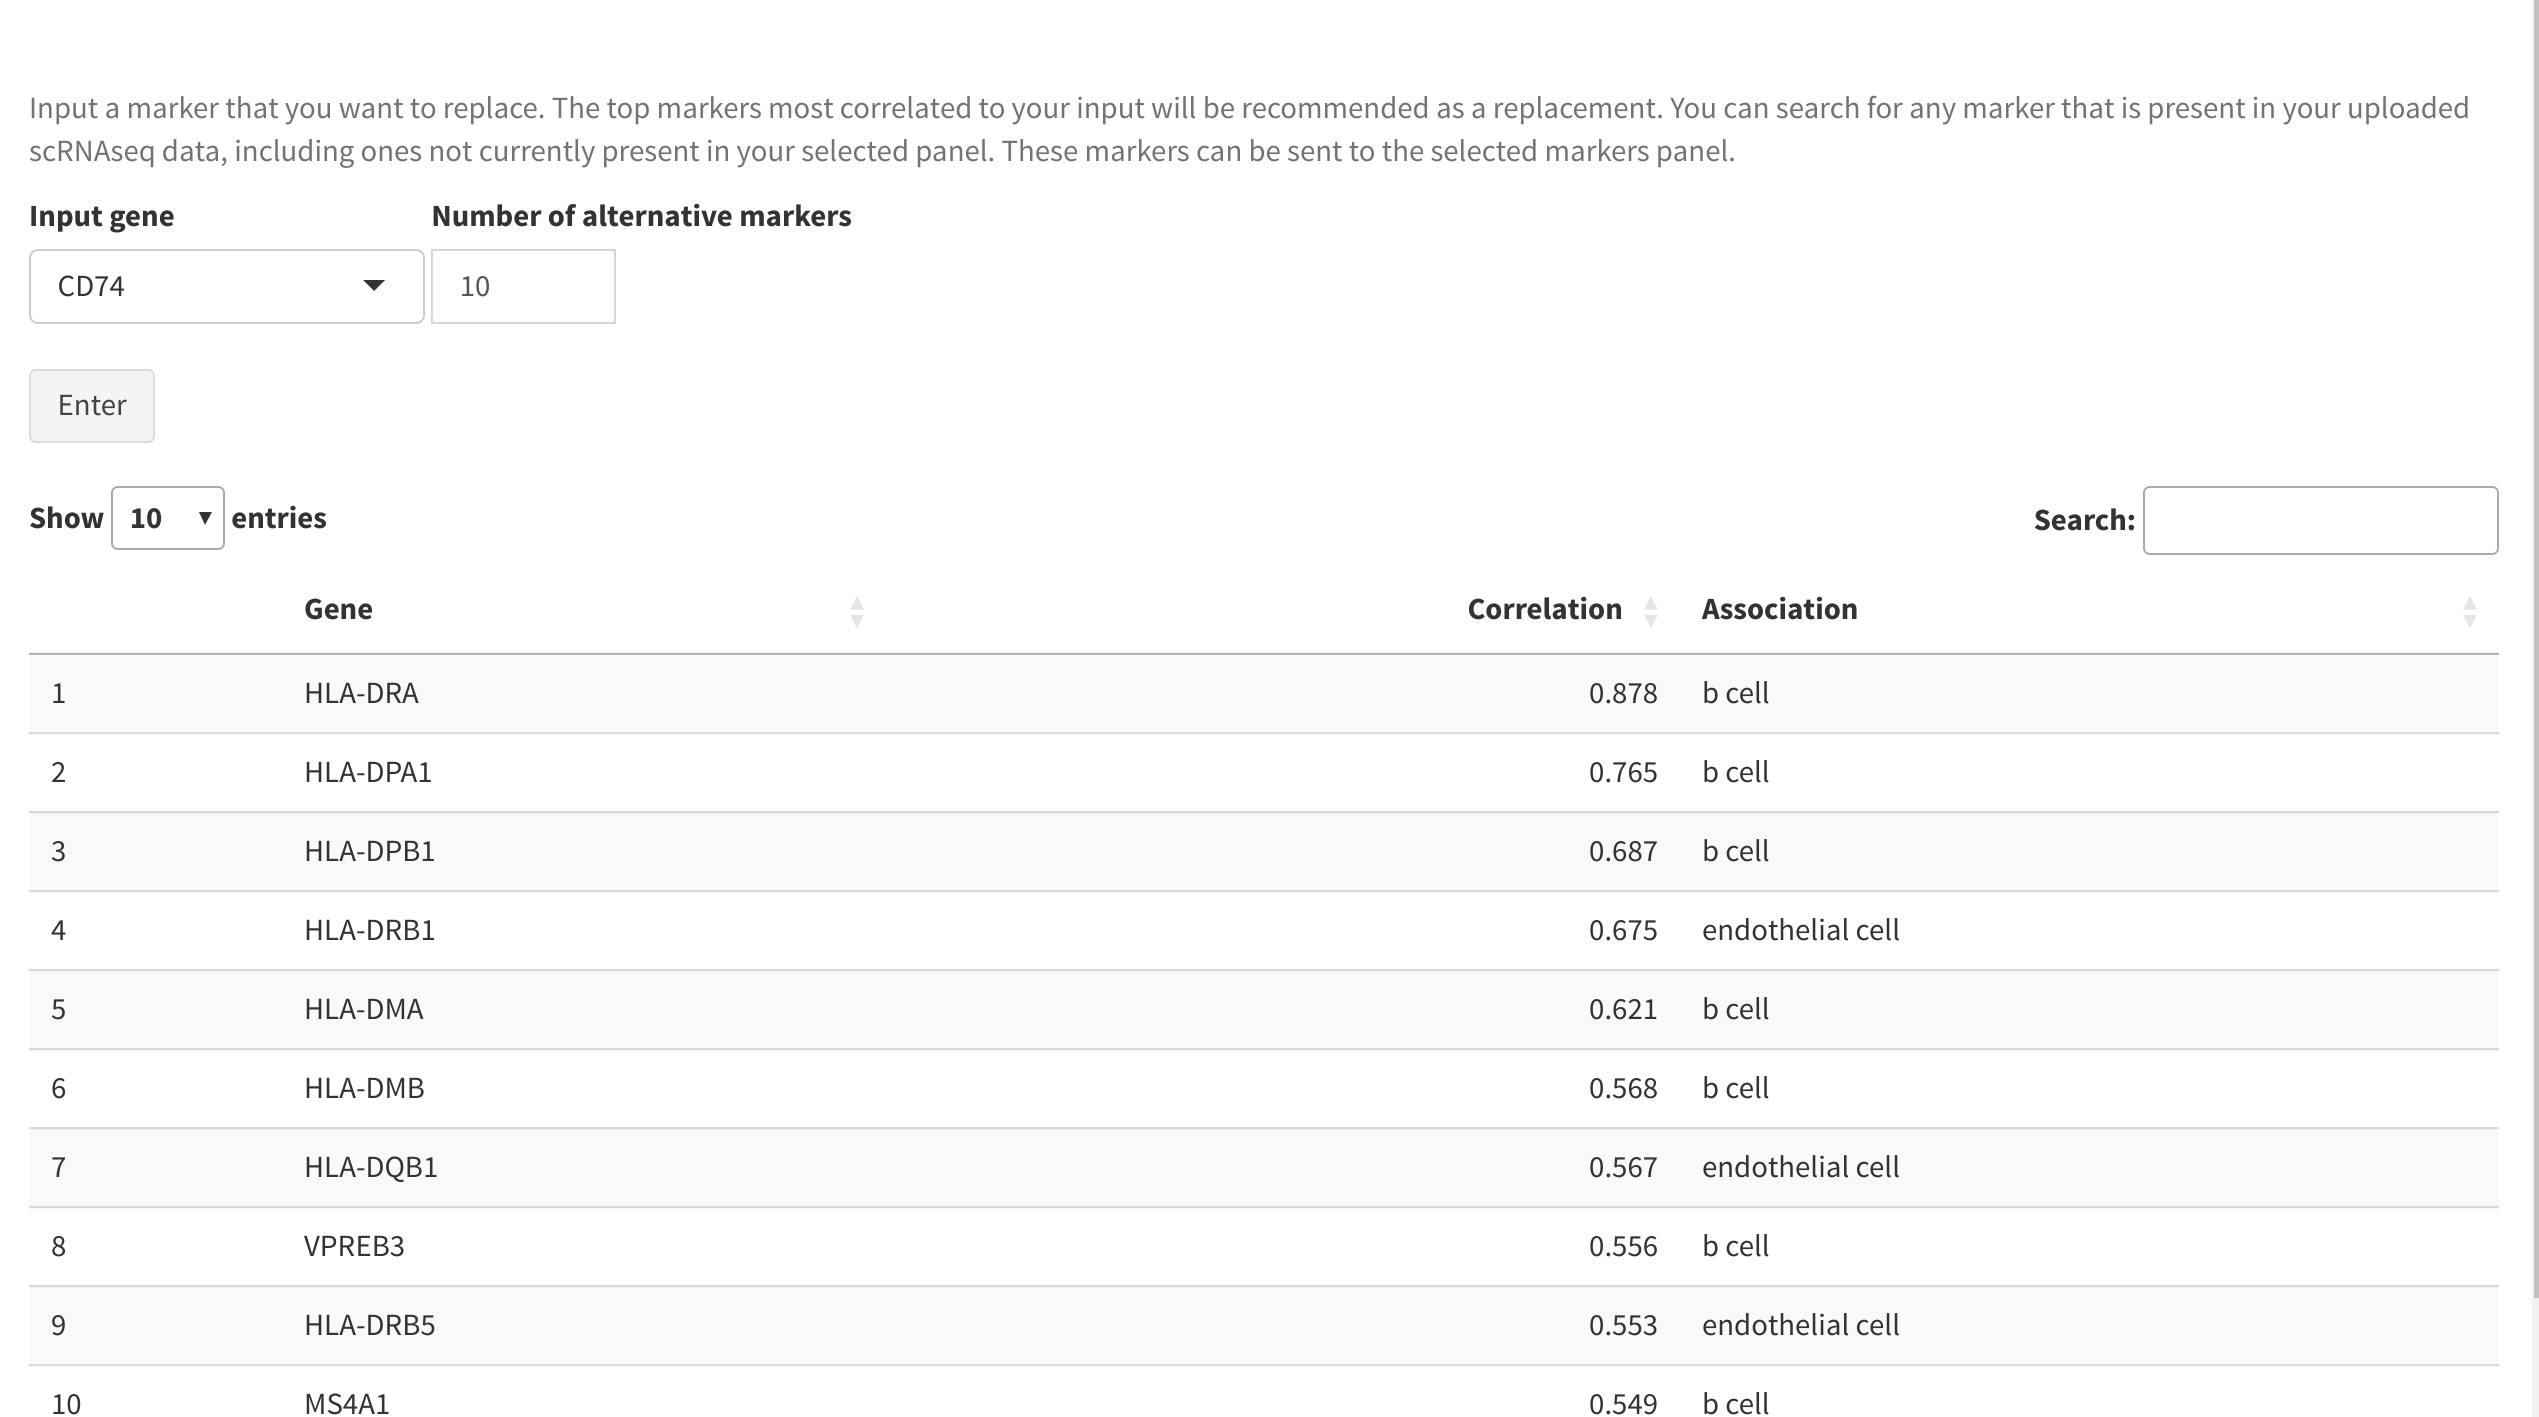
Alternative markers tab
Users may wish to replace a specific marker in a panel with another gene that has comparable expression. This can be achieved using the Alternative markers tab. Inputting a specific gene symbol will give a sorted list of the genes that are most correlated to its expression, and will include the cell type that the replacement marker is found to be most highly expressed in. Any of these candidate genes can be added to the current panel for re-analysis.
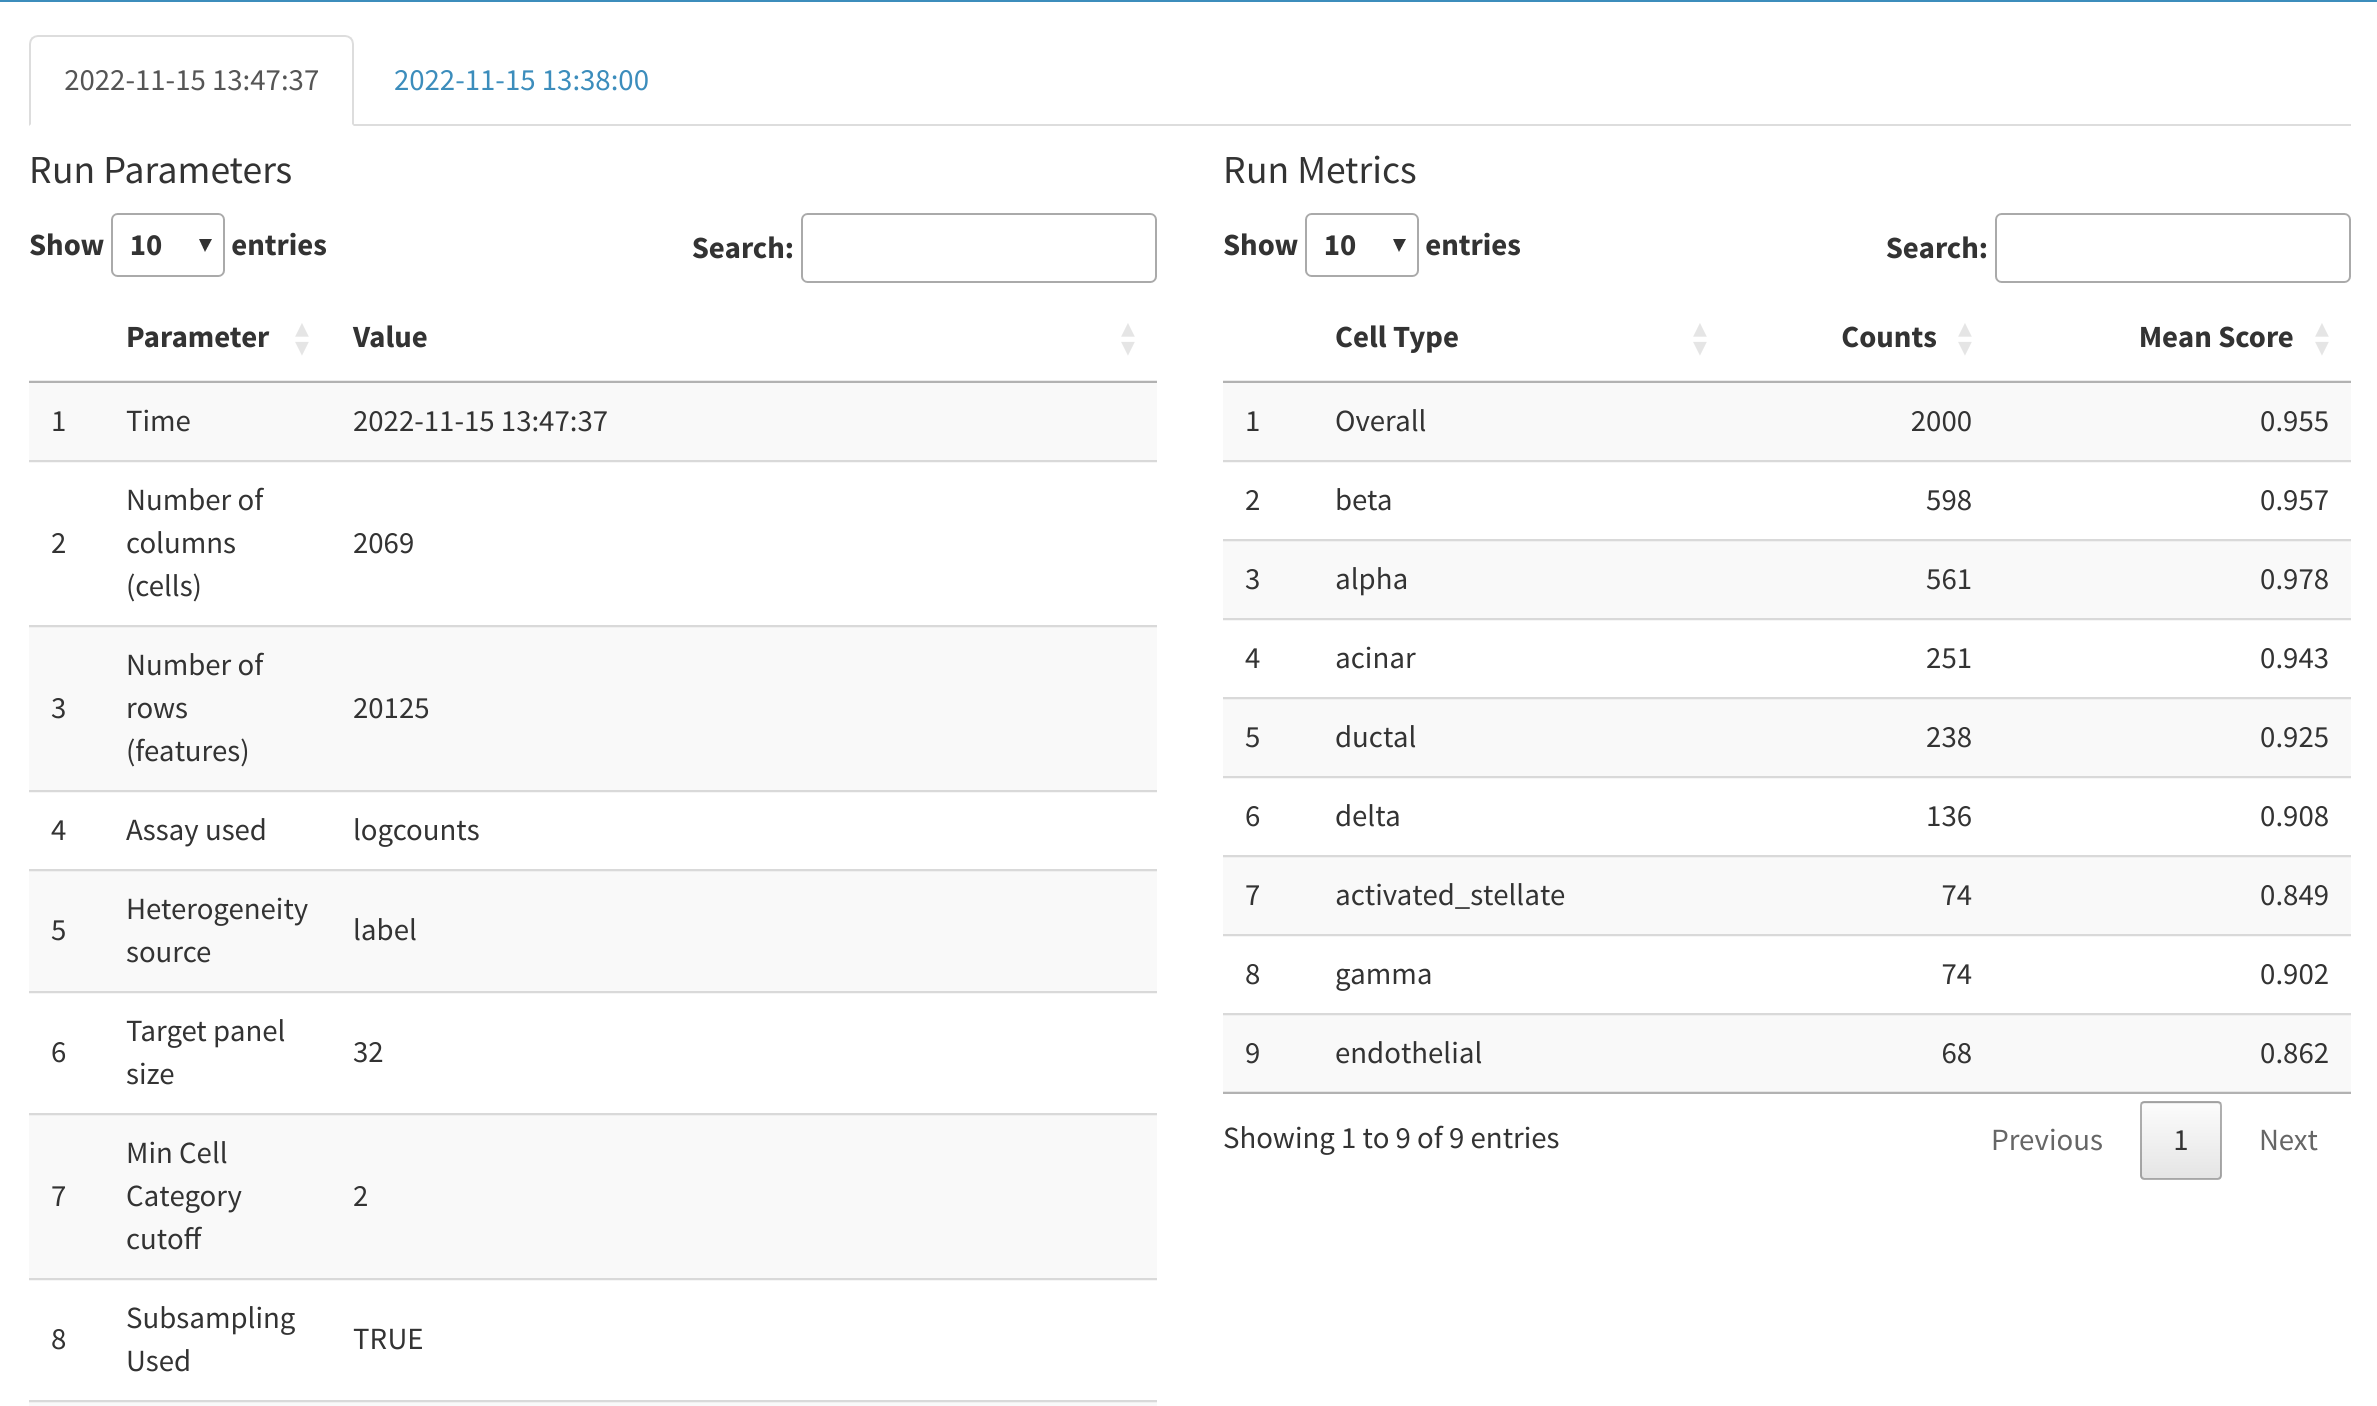
Run logs
cytomarker saves the input configuration parameters and metric scores from the previous 3 runs of cytomarker (within the same session). This allows the users to re-visit any previously modified parameters and compare the quality of the analysis when parameters are modified. Each run is tagged with the date and time that it commenced.
Negative markers
By default, cytomarker does not include negative markers for specific cell types, and choose instead to emphasize positive markers for each subtype analyzed. In practice, cytomarker will be able to identify mutually exclusive positive markers for the majority of canonical tissue types; these markers will in effect act as both a positive marker for one type, and negative for another. Users are encouragde to use both the violin plots and heatmaps as discussed above to confirm that a panel marker could act as a negative control for a specific subtype.
Retrieving relevant antibodies for the panel
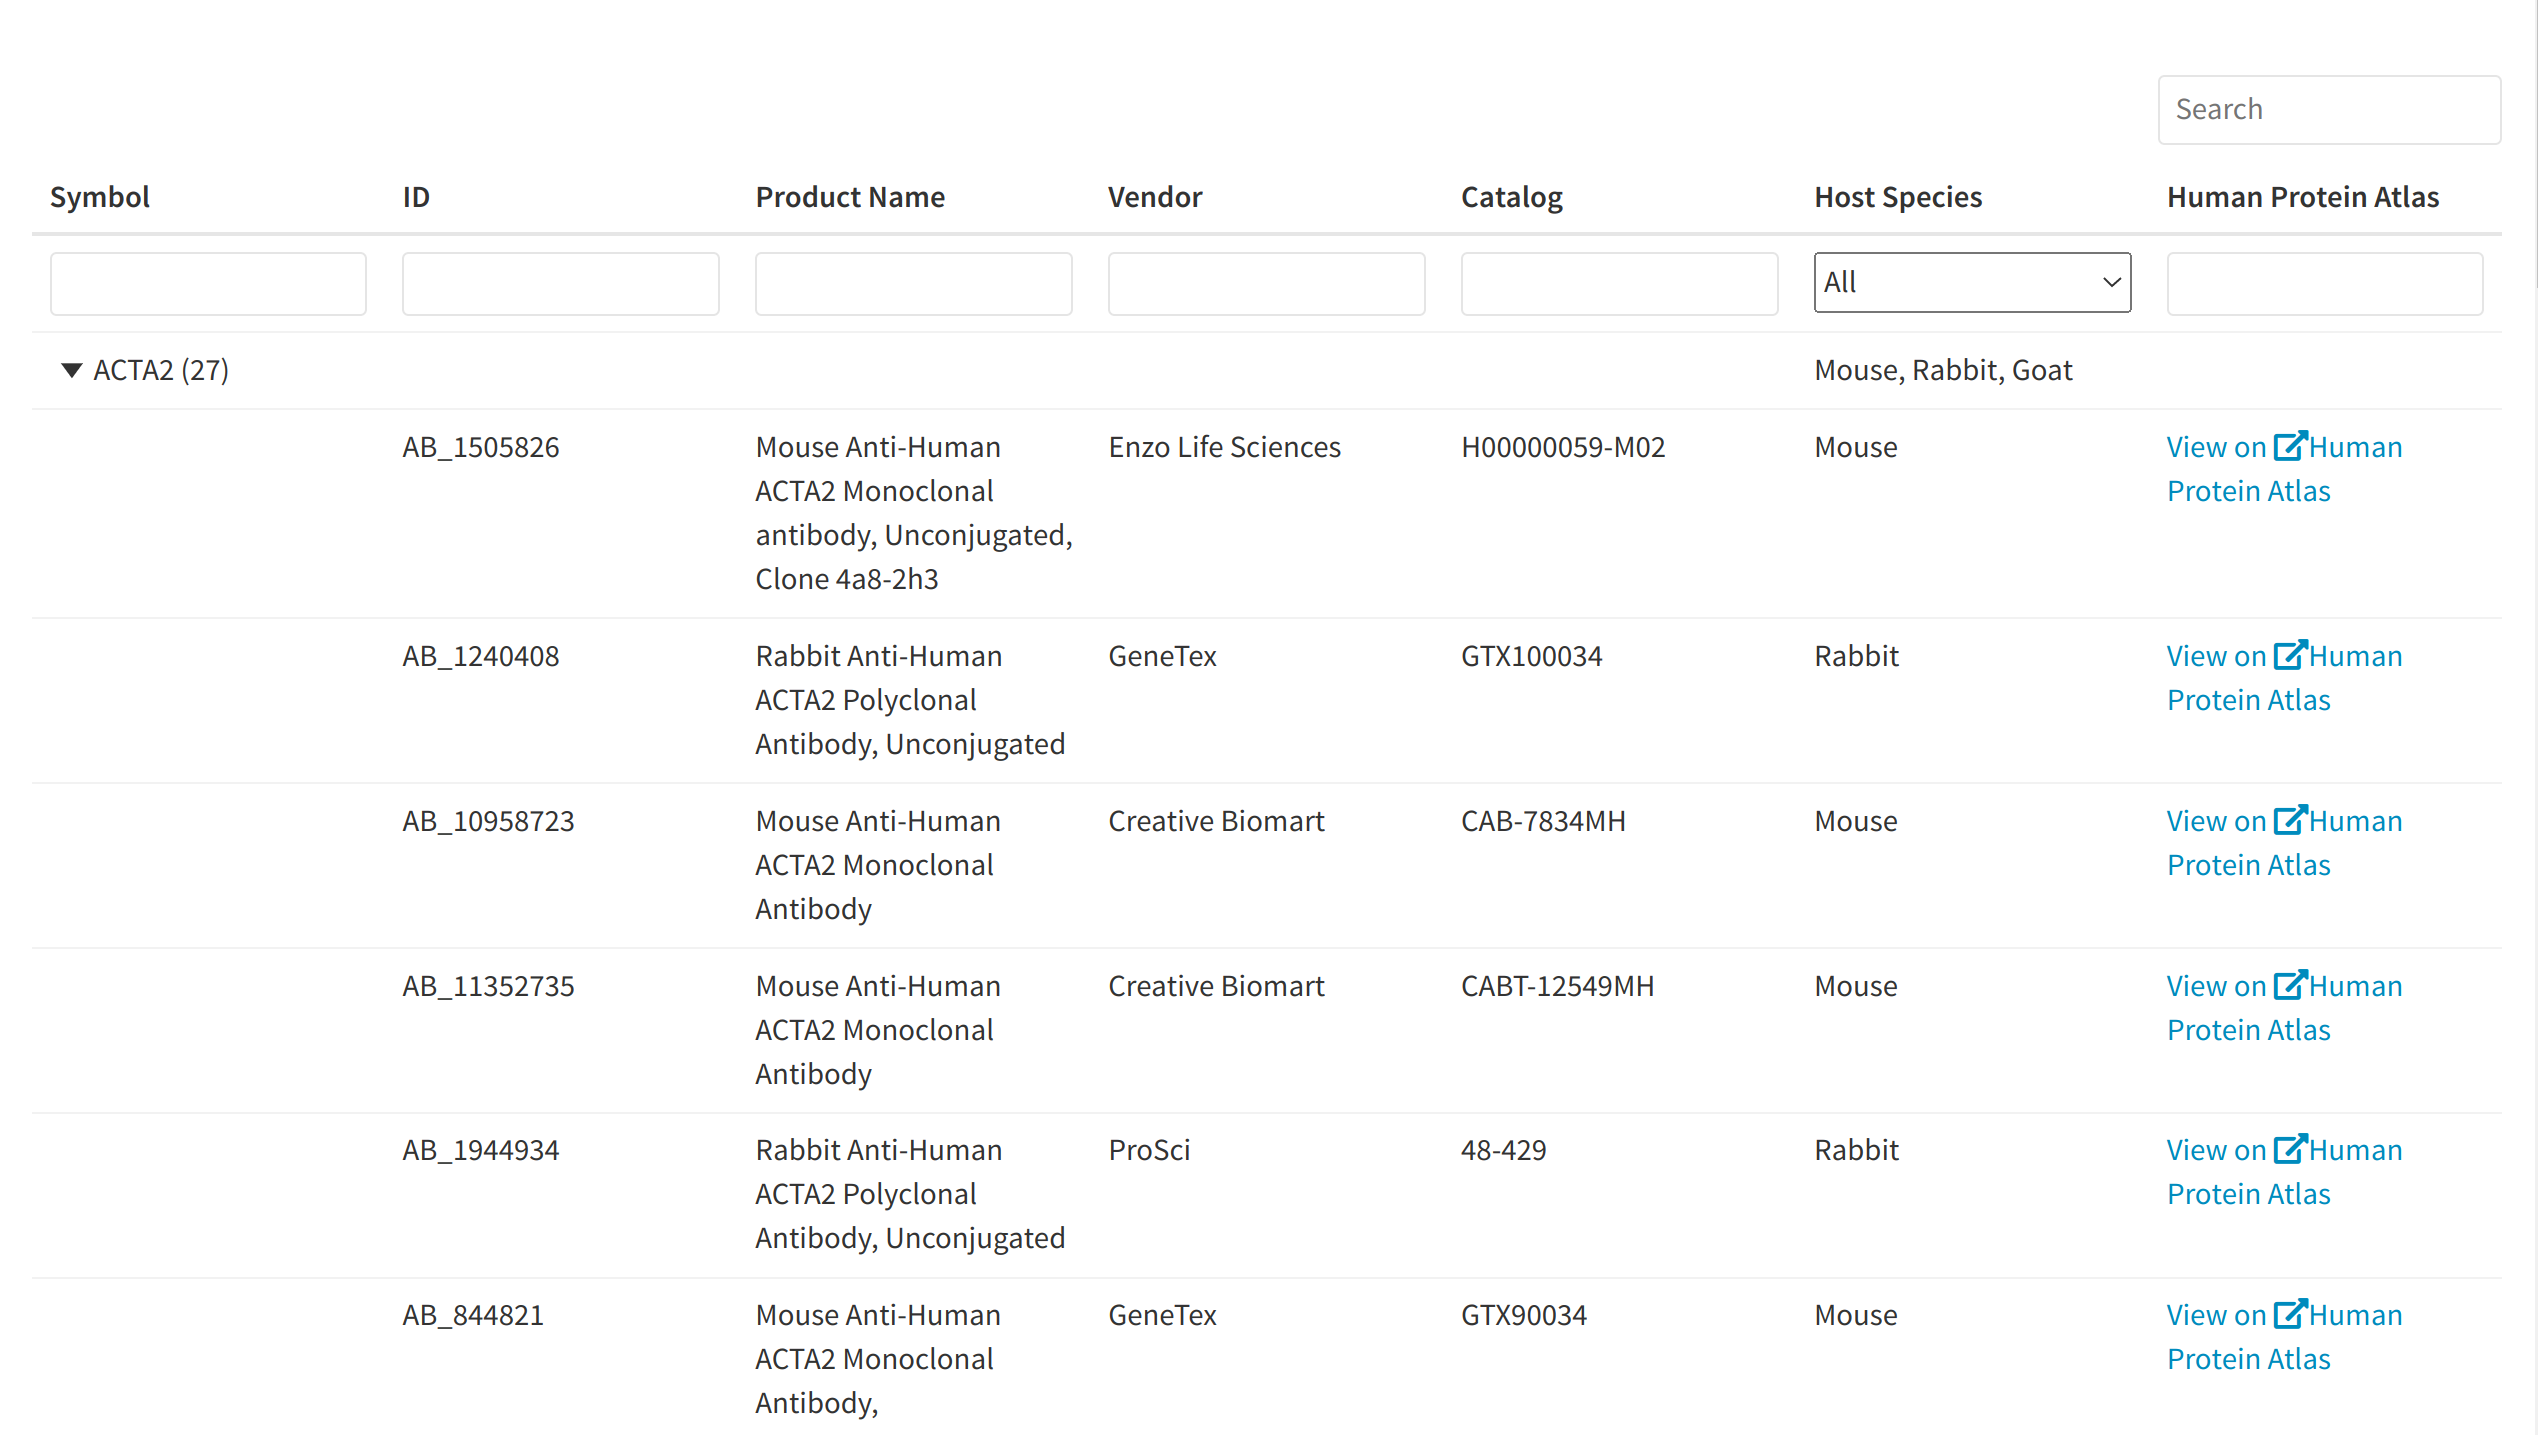
The tab Antibody explorer provides tabular information on any of the genes in the current panel, including the relevant product URLS where the antibody can be purchased online, as well as a link to the gene in the HUman Protein Atlas where additional information on expression, assays, validation data, etc. can be obtained. Users may refer to this table in order to gather more practical information about desired antibodies once analysis has been conducted and to find suitable products that can be purchased for imaging experiments.
Exporting the finished panel
The analysis can be saved locally using the Save panel feature on the main sidebar. cytomarker will prompt the user to save a zip folder to a local directory that contains a yml file of the run parameters and panel, which can be re-uploaded into cytomarker to re-commande analysis. Additionally, the various plots are exported in HTML format for external viewing.